Written by a search visibility strategist with 7+ years of hands-on experience building reporting dashboards for SEO, AEO, GEO, and LLM SEO clients. This guide reflects a working, monthly-use dashboard structure, not a theoretical list of every metric that exists.
Most businesses trying to track AI visibility make one of two mistakes: they track nothing beyond website traffic and miss what’s actually happening, or they try to track everything a monitoring tool offers and end up with a dashboard so cluttered no one reads it. Neither approach produces a report anyone can actually use to make decisions. This guide lays out a focused, practical AI visibility dashboard structure — the specific metrics worth tracking every month, why each one matters, and how to read them together instead of in isolation.
Why a Dedicated Dashboard Matters Now
AI-generated answers rarely include a clickable link, which means traditional analytics tools capture only a fraction of what’s actually happening to a brand’s visibility. A business can be named repeatedly inside ChatGPT and Gemini responses every month without a single one of those mentions showing up in Google Analytics. Industry guidance on this measurement gap makes the same point directly: connecting AI visibility data into a single, unified reporting view — rather than leaving it in a separate spreadsheet no one opens — is what turns scattered signals into something leadership can actually act on. You can read more in HubSpot’s guide to measuring AI search visibility ROI, which covers this integration challenge in more depth.
Without a dedicated dashboard, AI visibility work tends to get judged by the wrong yardstick — traffic — which, as covered in the broader shift away from traffic as a standalone success metric, frequently moves in the opposite direction of actual visibility.
The Five Metrics Worth Tracking Every Month
1. Visibility Score (Prompt Coverage)
This is the foundational metric: the percentage of a defined set of realistic buyer prompts where your business appears at all, across ChatGPT, Gemini, and Perplexity. Build a consistent list of 15 to 25 prompts covering brand-name questions, category questions, and comparison questions, and re-run the same list every month. This is the AI-search equivalent of tracking impressions — the number that tells you whether you’re showing up at all before anything else matters.
2. Share of Voice
Once visibility score establishes presence, share of voice places that presence in competitive context: what percentage of AI answers mention your business compared to two or three named competitors, across the same prompt set. A business appearing in 20% of relevant answers while a competitor appears in 60% tells a very different story than visibility score alone would suggest.
3. Citation Rate and Source Attribution
Citation rate tracks how often an AI response references your content directly, as distinct from simply mentioning your brand name without attribution. Tracking which sources an AI system pulls from when it does cite you — your own site, a review platform, a comparison article — reveals which third-party assets are actually driving your visibility, which becomes a direct action item for where to focus effort next.
4. Sentiment and Positioning Accuracy
A mention isn’t automatically a good outcome. Reviewing how an AI response frames your business — favorably, neutrally, or with outdated or inaccurate details — matters as much as whether you’re mentioned at all. A business appearing frequently but described with stale pricing or a discontinued service has a different problem than a business that isn’t appearing at all.
5. Branded Search Volume
Growing AI visibility often shows up first as an increase in people searching directly for your business name, since users who encounter a brand inside an AI conversation frequently follow up with a direct search rather than clicking a link that may not exist. Tracking branded search volume through Google Search Console alongside the four metrics above gives an early, complementary signal that AI-driven awareness is translating into real interest.
How to Read These Metrics Together
Sequence matters more than treating all five as equally weighted numbers on a page. Start with visibility score to confirm presence, layer share of voice to understand competitive standing, then use citation rate and sentiment to explain the quality behind that presence — not just whether you’re showing up, but how well. Branded search volume acts as a downstream confirmation signal, showing whether the visibility is translating into real audience behavior beyond the AI conversation itself.
If a stakeholder only wants one number, lead with visibility score, but always present it alongside share of voice and sentiment, since a single number without competitive or qualitative context is easy to misread.
A Simple Monthly Dashboard Structure
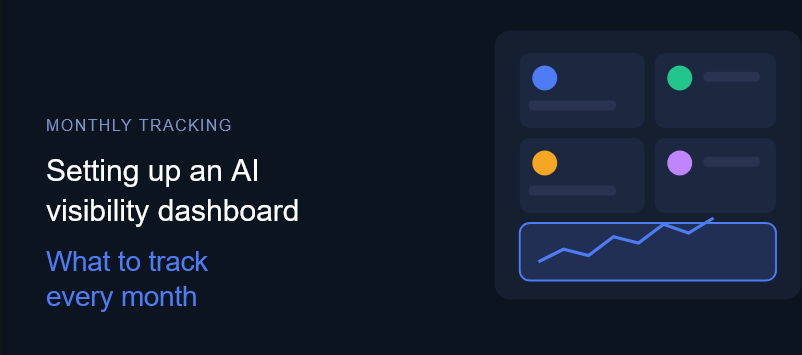
| Section | What Goes In It |
|---|---|
| Headline metric | Visibility score, current value and month-over-month change |
| Competitive context | Share of voice against 2–3 named competitors |
| Quality check | Citation rate, source attribution, and sentiment summary |
| Downstream signal | Branded search volume trend |
| Supporting notes | Notable prompt-level wins, losses, or content gaps observed |
This structure keeps the report short enough to actually get read every month, while still capturing the layered picture — presence, competition, quality, and downstream impact — that a single number can’t provide on its own.
Building the Underlying Prompt Set
The quality of every metric above depends entirely on the prompt set behind it. A useful monthly prompt library typically includes:
- 5–8 brand-name questions (“What is [business]?”, “Is [business] good for X?”)
- 5–10 unbranded category questions (“Best [category] for [use case/location]”)
- 5–7 comparison questions (“[Business] vs. [competitor]”)
Keep this list consistent month to month so trend data is meaningful, and revisit it quarterly to add new questions as your business, competitors, or category evolve. This same prompt-testing discipline underpins the work involved in AEO and GEO, since improving these metrics requires acting on exactly what the dashboard reveals — restructuring content, strengthening entity signals, and building the topical depth that shifts citation rate and share of voice over time. It also depends on the underlying credibility and structured data foundation that LLM SEO work is built around.
Common Mistakes to Avoid When Building This Dashboard
- Changing the prompt set too often, which breaks the ability to track meaningful trends over time.
- Tracking too many metrics at once, which produces a report too cluttered for stakeholders to actually use for decisions.
- Testing prompts only once per month with no repetition, since AI responses vary between sessions and a single run can be misleading.
- Ignoring sentiment and only counting raw mentions, which misses cases where visibility exists but the framing is inaccurate or unfavorable.
- Reporting AI visibility in a completely separate document from existing marketing metrics, rather than integrating it into one coherent view stakeholders already check regularly.
Frequently Asked Questions
What’s the single most important metric to track for AI visibility?
If only one metric were possible, visibility score — the percentage of tracked prompts where your business appears — provides the clearest foundational signal. It should still be paired with share of voice and sentiment for proper context.
How often should I update my AI visibility dashboard?
Monthly is a practical cadence for most businesses, since it balances catching meaningful trends against the effort of running and reviewing repeated prompt tests. Some teams spot-check top prompts weekly, since citation patterns can shift as AI models update.
Do I need a paid tool to build an AI visibility dashboard?
Not necessarily to start. A manually maintained prompt set, run consistently and logged in a simple spreadsheet, can produce meaningful monthly data. Paid monitoring tools add automation and scale as tracking needs grow more complex.
How many prompts should be in my tracking set?
Somewhere between 15 and 25 prompts, spanning brand, category, and comparison questions, is typically enough to produce a meaningful, trackable picture without becoming unmanageable to run and review consistently every month.
What’s the difference between a mention and a citation?
A mention references your brand name without a direct source link, while a citation includes a more direct reference or attribution to your specific content. Tracking both separately matters, since a business can have high mentions but low citations, or the reverse, and each points to a different fix.
Should AI visibility metrics replace my traditional SEO dashboard?
No. AI visibility metrics should sit alongside traditional SEO and analytics data, not replace it, since traffic, rankings, and AI visibility each capture a different part of the full picture.
A useful AI visibility dashboard isn’t the one with the most metrics — it’s the one with the right five, tracked consistently, and read together rather than in isolation. Visibility score establishes presence, share of voice adds competitive context, citation rate and sentiment explain the quality behind the numbers, and branded search volume confirms the downstream impact. Built this way, a monthly dashboard stops being a curiosity and starts being something that actually shapes what content, structure, and strategy work comes next.